Registered customer groups shown here are non-profit organisations, large enterprises, individuals and small and medium enterprises.
The data for these statistics is available for download from the links below.
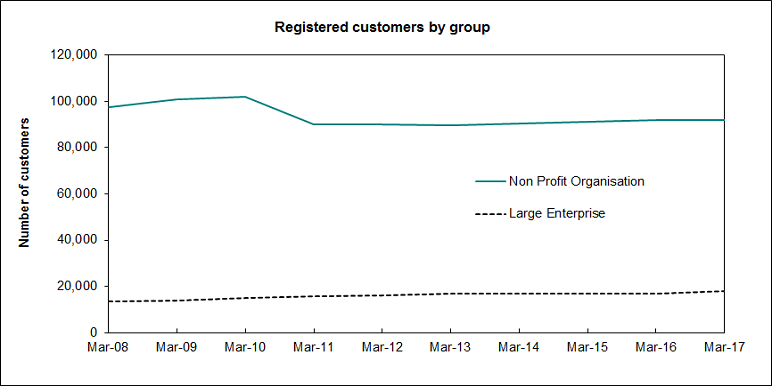
Graph of registered customers by group (non-profit organisation vs large enterprise)

The graph has 2 lines showing the number of registered customers for non-profit organisations and for large enterprises.
Over the period 2008 to 2017 the number of registered customers within large enterprises increased 32% and the number of non-profit customers decreased by 6%.
The significant decrease in the number of non-profit organisations is attributable to a review of non-profit organisations by Inland Revenue in the 2010 year. Non-profit organisations no longer operating, and those whose non-profit status was no longer valid, were removed from the non-profit customer group.
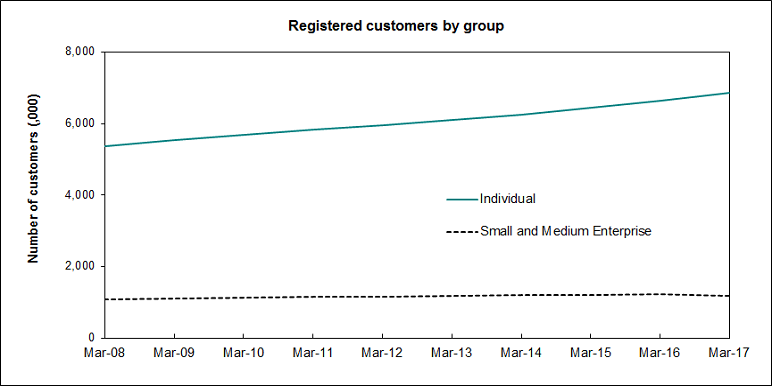
Graph of registered customers by group (individual vs small and medium enterprises)

The graph has 2 lines showing the number of registered individuals and small and medium enterprises (SMEs). Over the period 2008 to 2017 registered individuals increased 28% and registered SMEs increased 9%.

