This section shows the dynamics of overdue debt case age from the 2008 to 2017 financial years. It covers both overdue tax debt and overdue child support debt. The debt age structure is presented both for dollar values and debt cases. The age of each debt case is weighted based on weighted overdue debt case age. Due to rounding, the proportions may not always add to 100%.
The data for these statistics is available for download from the links at the bottom of the page.
Graph of percentage of debt cases by age bands (tax debt)
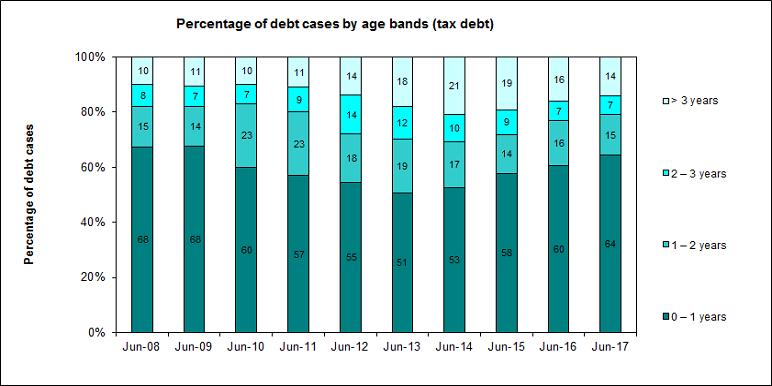
This graph shows the proportion of overdue tax debt cases by debt age, for the 2008 to 2017 financial years (ending June).
From 2008 to 2017, the proportion of debt cases more than 3 years old has increased from 10% to 14%. Conversely, the proportion of debt cases less than 1 year old has decreased from 68% to 64%.
Graph of percentage of debt value by age bands (tax debt)
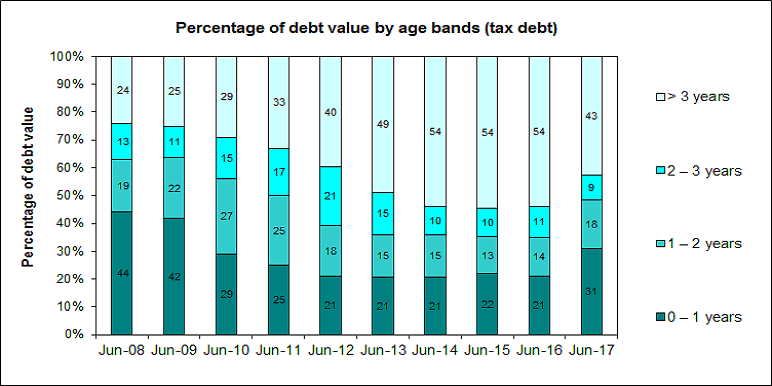
This graph shows the proportion of the value of overdue tax debt value by debt age, for the 2008 to 2017 financial years (ending June).
This graph shows that from 2008 to 2017, the proportion of tax debt that is more than 3 years old has almost doubled in value. Conversely, the proportion of tax debt that is less than a year old has reduced from 44% to 31%.
Graph of percentage of debt cases by age bands (child support debt)
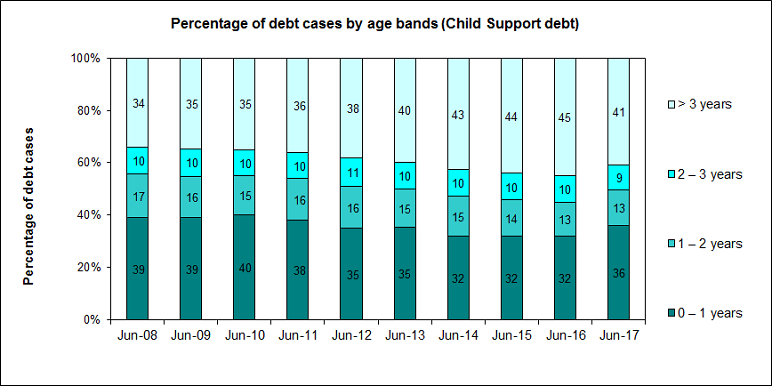
This graph shows the proportion of overdue child support debt cases by debt age, for the 2008 to 2017 financial years (ending June).
This graph shows that the proportion of child support debt cases that are more than 3 years old has increased from 34% to 41%. Correspondingly, the proportion of child support debt cases that are less than 1 year old has decreased from 39% to 36%.
Graph of percentage of debt value by age bands (child support debt)
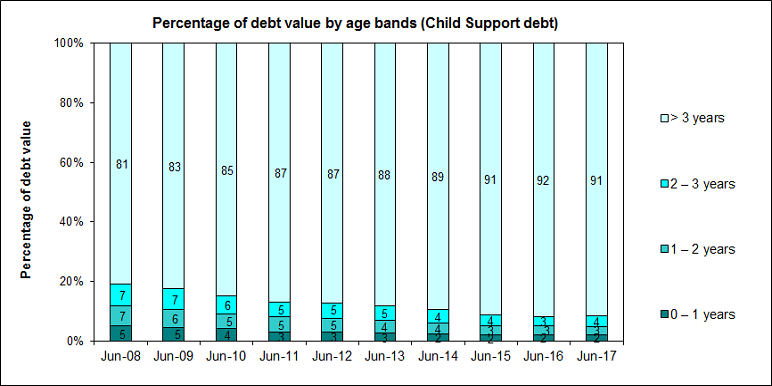
This graph shows the proportion of the value of overdue child support debt by debt age, for the 2008 to 2017 financial years (ending June).
This graph shows that from 2008 to 2017, the proportion of child support debt that is more than 3 years old has increased from 81% to 91%. Conversely, the other categories have reduced.
Note:
The large increase in tax debt over 3 years old in 2012 was due to significant debt coming out of the litigation process and being recognised as debt in the debt book.