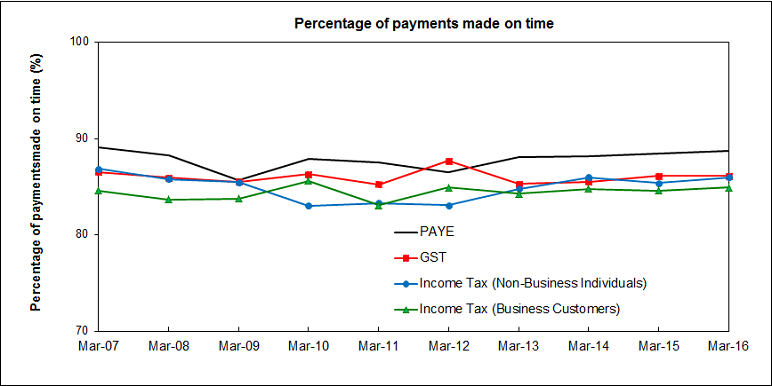
This section shows the percentage of on time payments for the major tax types.
The data for these statistics is available for download from the links at the bottom of the page.
Graph of percentage of payments made on time from 2007 to 2016

This graph has 4 lines showing the percentage of payments made on time from 2007 to 2016 for 4 separate tax types: PAYE, GST, Income Tax (Non-Business Individuals) and Income Tax (Business Customers).
From a payment compliance perspective, all 4 tax types have been reasonably stable over the entire period (most between 85-90%).

