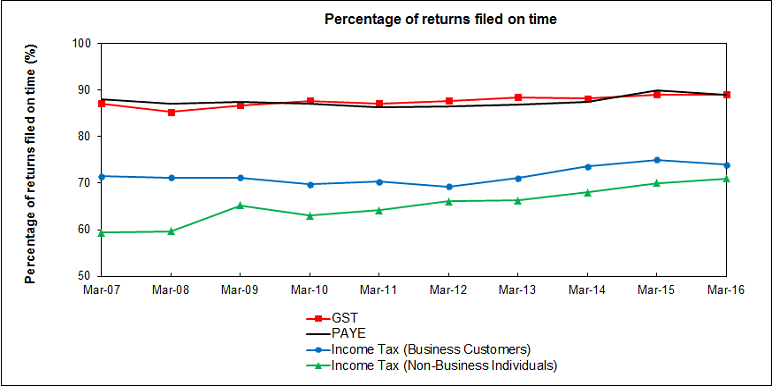
This section shows the ratio of returns filed on time to the total number of filing per tax year. The ratio is presented separately for tax types and customer groups.
The data for these statistics is available for download from the links at the bottom of the page.
Graph of percentage of returns filed on time from 2007 to 2016

This graph shows the percentage of returns filed on time for GST, PAYE, and income tax for both businesses and non-business individuals from 2007 to 2016.
Over the period, GST and PAYE are consistently shown to have relatively higher rates of filing compliance (around 90%) than income tax (around 70%). Income tax filing compliance for Non business individuals has improved by approximately 20% over the decade.
Last updated:
28 Apr 2021

