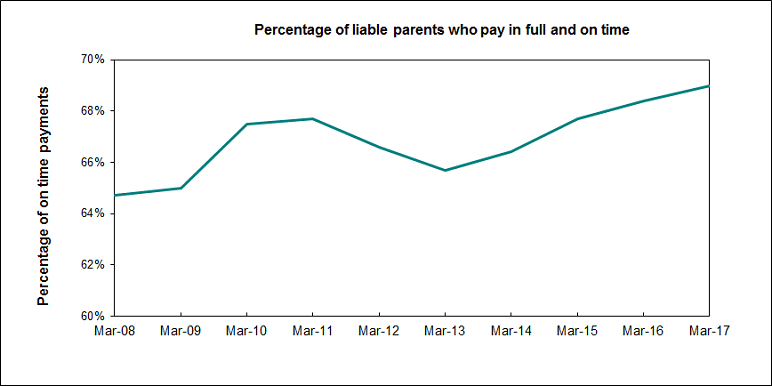
This section shows the percentage of payments made by liable parents in full and on time.
The data for these statistics is available for download from the links at the bottom of the page.
Graph of percentage of liable parents who pay in full on time

The graph shows the percentage of liable parents who pay their child support obligation in full and on time from 2008 to 2017.
The percentage of liable parents who pay in full and on time increased from 2013. The percentage at the end of March 2017 was 69%.
Note
- The methodology changed from 2013 onwards.
- Cases which Inland Revenue manage on behalf of overseas agencies and uncollectable debt cases are excluded.
Last updated:
28 Apr 2021

