All current KiwiSaver data, including monthly data, is available in Excel downloads located on the Datasets for KiwiSaver statistics page. Annual data is due to be uploaded by 30 September.
Datasets for KiwiSaver statistics
Number of KiwiSaver members, by annual income as at 30 June
This graph shows the number of active/provisional KiwiSaver members, by annual income as at 30 June 2025.
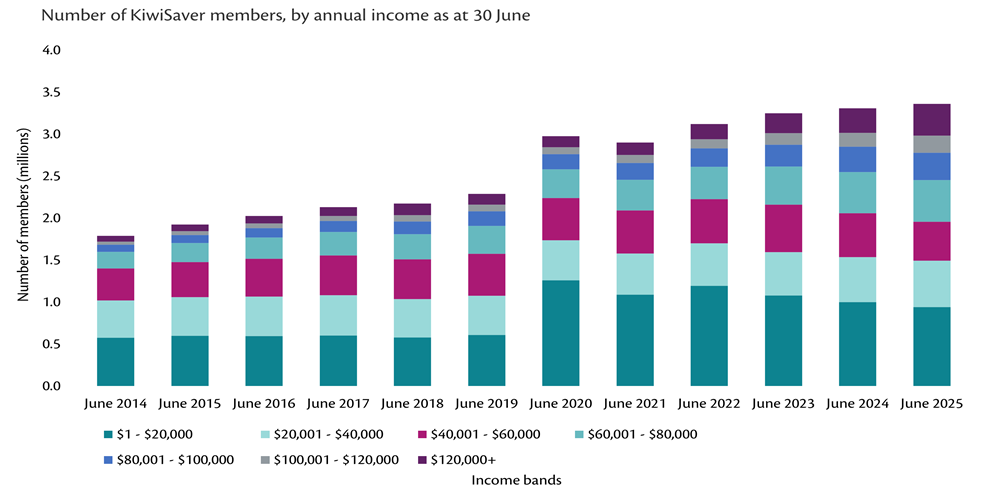
Between June 2015 and June 2025, the number of members who earned:
- between $1 to $20,000 increased from 598,656 to 942,973
- between $20,001 to $40,000 increased from 461,215 to 550,365
- between $40,001 to $60,000 increased from 416,204 to 465,672
- between $60,001 to $80,000 increased from 226,596 to 493,347
- between $80,001 to $100,000 increased from 97,337 to 325,791
- between $100,001 to $120,000 increased from 45,978 to 204,570
- more than $120,000 increased from 78,809 to 379,977.
Notes:
- KiwiSaver membership numbers may include:
- People living overseas. If a KiwiSaver member moves overseas, they can choose to remain a member, even if they no longer reside here.
- People who have died, as the process of closing their accounts and exiting can take time to complete.
- People with no income are excluded.
- The total income includes PIE (portfolio investment entity) income. For some members, their only income is from their KiwiSaver investment, resulting in PIE income.
- Income details are for the tax year prior to the financial year. For example, income details for members as at 30 June 2025 are from the 2024 tax year.
- To ensure data confidentiality we have grouped some categories.
- Additional data is available in the KiwiSaver annual Excel download.
- From April 2020, KiwiSaver information is reported from a new system.
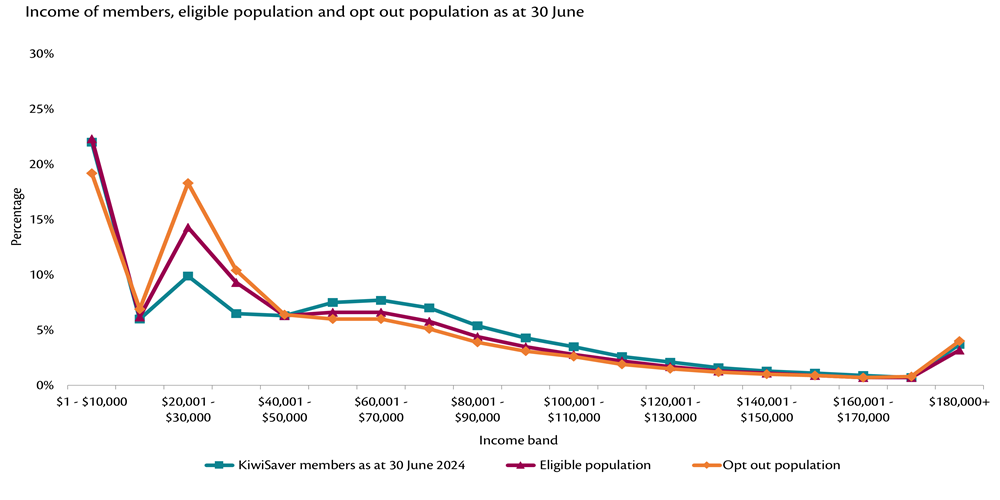
Income of members, eligible population and opt-out population as at 30 June
This graph shows the income of KiwiSaver members and eligible population and opt-out population as at 30 June 2025.
- Notes:
- KiwiSaver membership numbers may include:
- People living overseas. If a KiwiSaver member moves overseas, they can choose to remain a member, even if they no longer reside here.
- People who have died, as the process of closing their accounts and exiting can take time to complete.
- People with no income are excluded.
- Eligibility figures are indicative. It is the scheme provider, or employer, who determines if someone is eligible to join KiwiSaver.
- The total income includes PIE (portfolio investment entity) income. For some members, their only income is from their KiwiSaver investment, resulting in PIE income.
- Income details are for the tax year prior to the financial year. For example, income details for members as at 30 June 2025 are from the 2024 tax year.
Income of individuals with a current opt-out status as at 30 June
| Income (2024 tax year) | Percentage |
|---|---|
| $1 - $10,000 | 19.2% |
| $10,001 - $20,000 | 6.9% |
| $20,001 - $30,000 | 18.3% |
| $30,001 - $40,000 | 10.4% |
| $40,001 - $50,000 | 6.4% |
| $50,001 - $60,000 | 6.0% |
| $60,001 - $70,000 | 6.0% |
| $70,001 - $80,0000 | 5.1% |
| $80,001 - $90,0000 | 3.9% |
| $90,001 - $100,000 | 3.1% |
| $100,001- $110,000 | 2.6% |
| $110,001 - $120,000 | 1.9% |
| $120,001 - $130,000 | 1.5% |
| $130,001 - $140,000 | 1.2% |
| $140,001 - $150,000 | 1.0% |
| $150,001 - $160,000 | 0.9% |
| $160,001 - $170,000 | 0.7% |
| $170,001 - $180,000 | 0.8% |
| $180,000+ | 4.0% |
| Total | 100.00% |
Notes:
- Income details are for those individuals who have a status of 'opt-out' as at 30 June 2025 with income for the 2024 tax year.
- Individuals with no income information for the year are excluded.
- Totals may not equal the sum of the rows due to rounding.
Last updated:
30 Sep 2025