The total number of tax convictions under the Tax Administration Act 1994 in each calendar year.
The information is supplied by the Ministry of Justice and may differ marginally from other analyses due to timing and differences in counting cases involving:
- multiple defendants
- multiple offences
- alternative charges, and
- representative charges.
However, the numbers are broadly representative of Inland Revenue's prosecution activity.
Due to changes in the methodology, the figures before 2013 differ from those published previously.
The data for these statistics is available for download from the links at the bottom of the page.
Graph of number of tax convictions (excluding failure to furnish) from 2007 to 2016
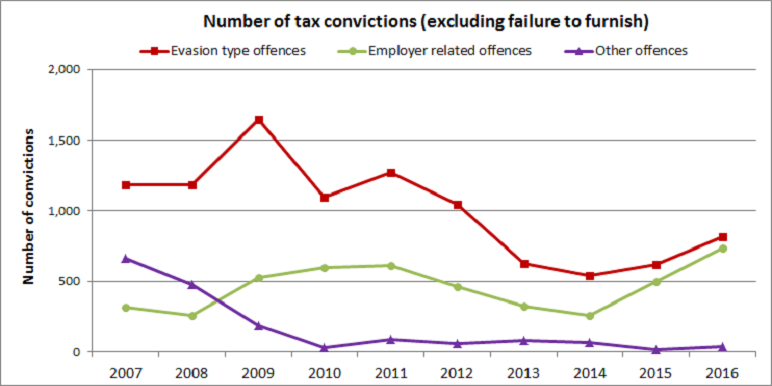
This graph has three lines plotting the number of tax convictions under the Tax Administration Act 1994 over the period 2007 to 2016 for the following types of offences:
- evasion
- employer-related
- other.
Over the decade in question the number of tax convictions for:
- evasion type offences has reduced by 31%.
- employer-related offences has more than doubled (up 134%)
- other offences has decreased by 95%.
Graph of failure to furnish returns and all tax convictions from 2007 to 2016
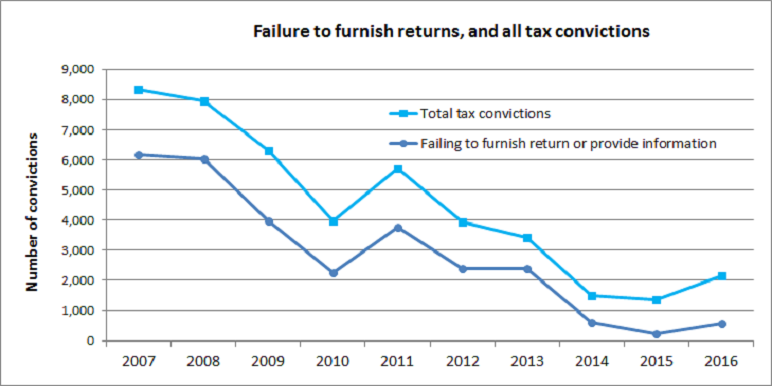
This graph has two lines plotting the total number of tax convictions versus the number of convictions solely for failing to furnish a return or provide information for the period 2007 to 2016.
From 2007 to 2016:
- The total number of tax convictions under the Tax Administration Act 1994 has reduced from 8,321 to 2,137 (or by 74%).
- The number of convictions under the Tax Administration Act 1994 relating solely to those failing to furnish returns or not providing the required information has fallen from 6,164 to 556 (or by 91%).